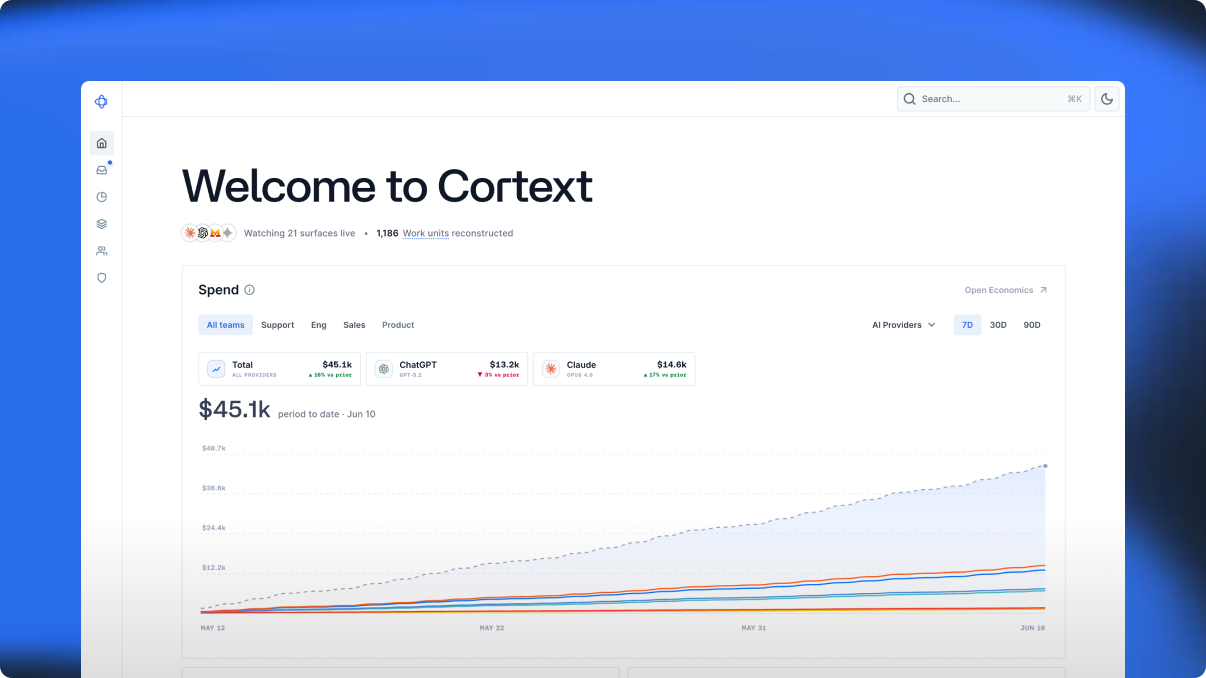
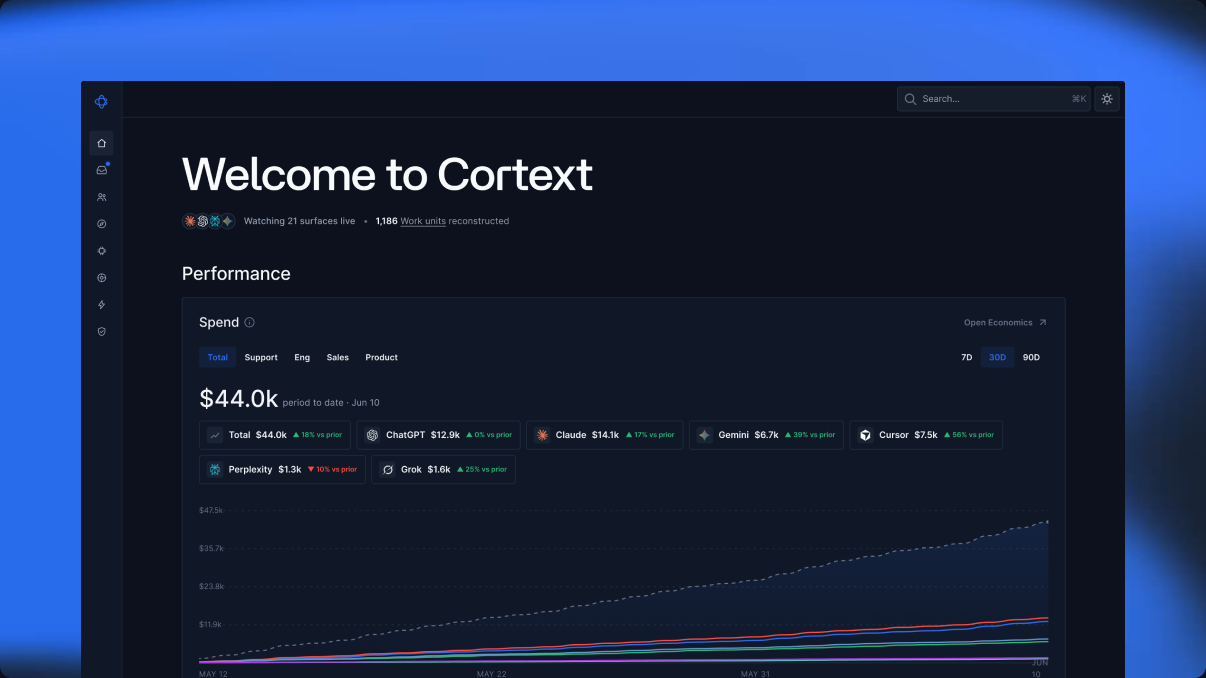
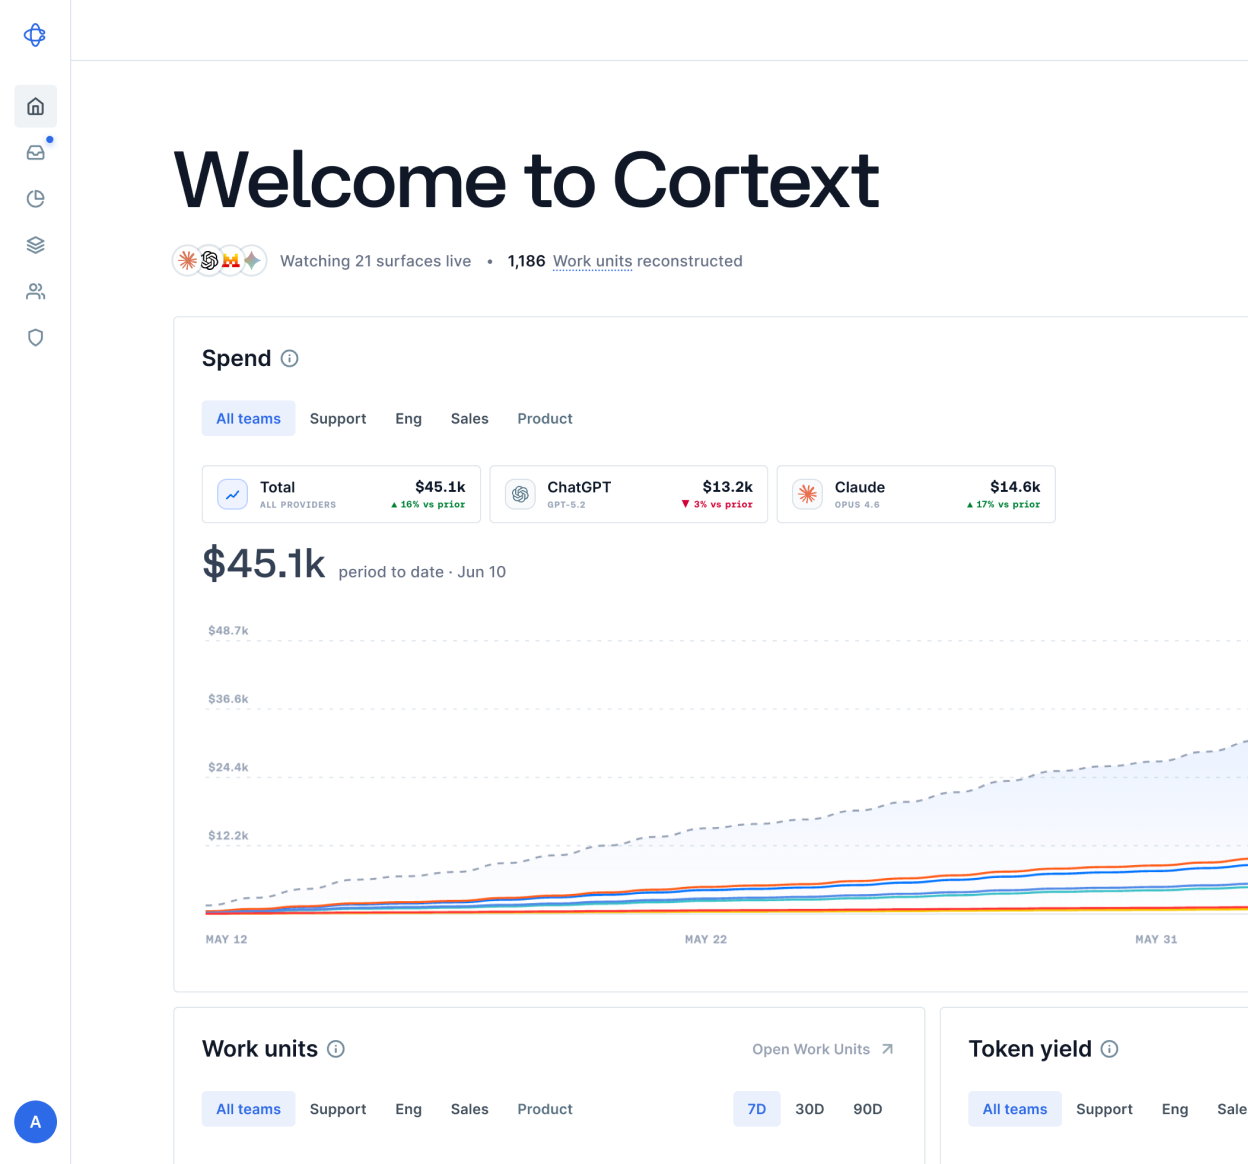
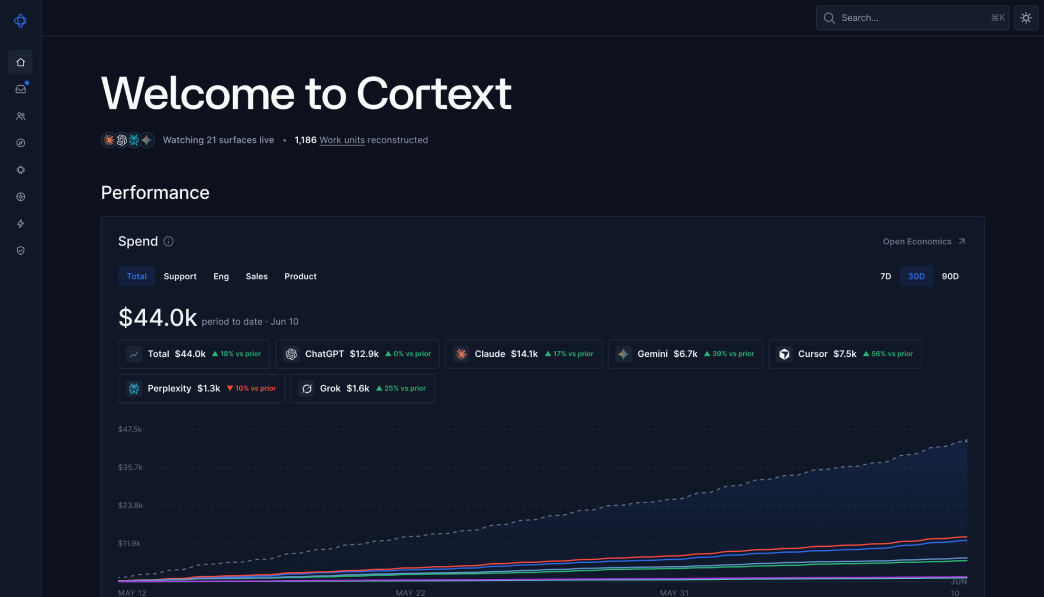
Usage & Stats
Everything /usage, /stats, and /context show one person in a terminal — rolled up for the org, with the economics underneath.
93% of context is replay, not fresh input
wall time runs 3.1× API time — agents wait on humans more than the reverse
lines merged per $ of agent spend · code agents only
The org has used ~2,310× more tokens than War and Peace.
Session economics
/usage parity · open a session for its cache + context ledgerSessionModelCostAPI · wallCodeContext replay
Cache read is the quiet hero: ~93% of context tokens are replayed, already-paid-for context. The leak is sessions that rebuild it fresh.
The org's rhythm
/stats parity · activity, streaks, and the fun numberMon
Wed
Fri
LessMore
Favorite modelgemini-3-flash-previewTotal tokens1.42bSessions2,341Active days26/30Most active dayJun 10Longest session6d 14h 8mLongest streak11 daysCurrent streak4 days
The org has used ~2,310× more tokens than War and Peace.
Tokens per day, by model
/stats · models — step chart, terminal-flavoredgemini-3-flash-preview(62.3%)In: 883.1m · Out: 1.7mclaude-opus-4-8(18.7%)In: 61.5m · Out: 7.0mgpt-5.5(12.4%)In: 38.2m · Out: 4.1mfable-5(6.6%)In: 3.8m · Out: 10.6m
Runway — who's close to a limit
/usage windows · burn · ceiling forecastsPersonPlan5h windowWeekOpus · wkResetsBurn · 7D
Mirrors what each person sees in /usage— quota windows, reset timers, burn — plus the forecast the terminal can’t make: who hits a ceiling, and when.


